")
In one of my recent data automation projects, I worked on streamlining the way we collect, transform, and analyze public data from the Department of Government Expenditure (DOGE). The goal wasn’t just to build another data pipeline—it was about turning fragmented API responses into something accessible: dashboards, reports, and even a chatbot interface that could answer questions in plain English.
Here’s how I went from raw API data to rich insights—step by step.
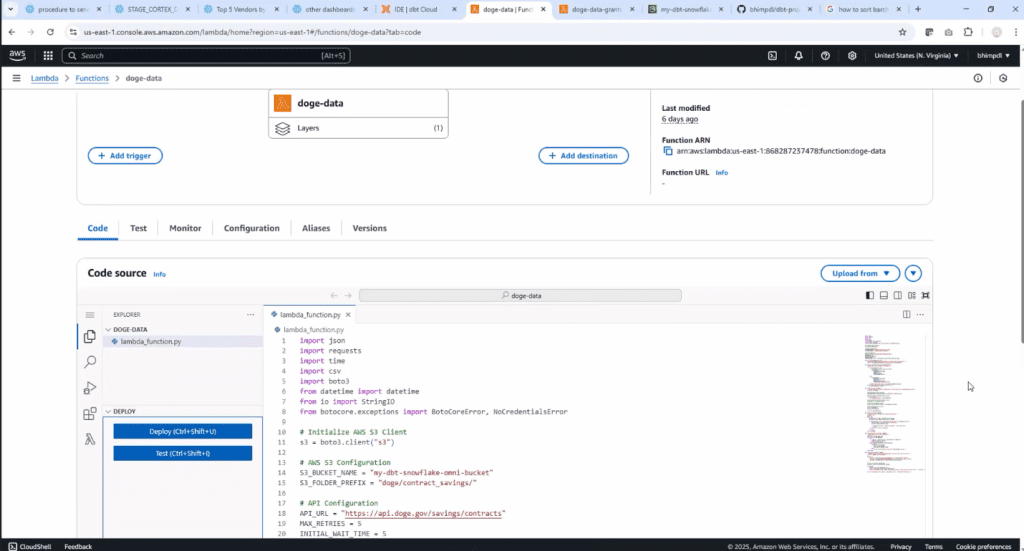
1. Starting at the Source: Collecting DOGE Data
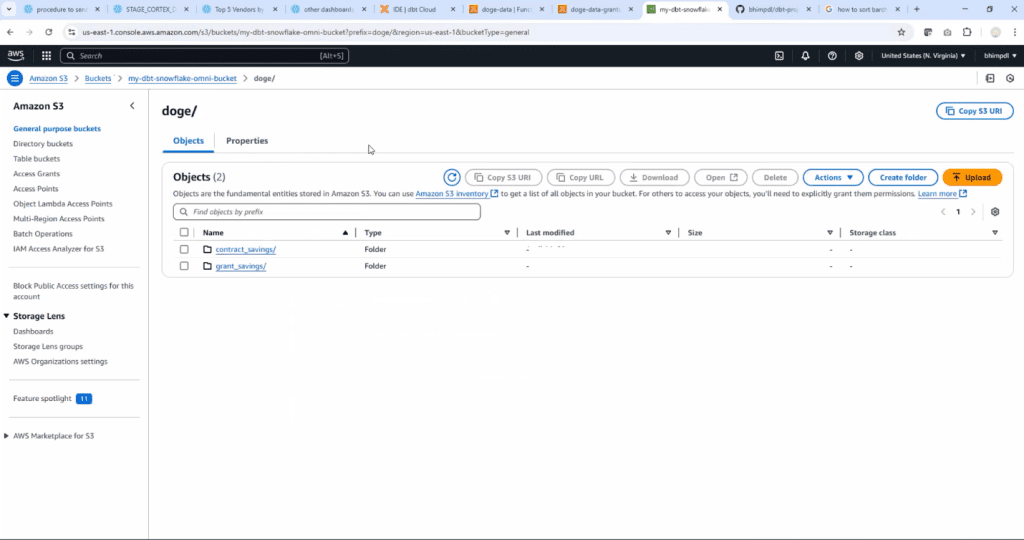
The first step was automating data ingestion. I used an AWS Lambda function to regularly call the DOGE API using the EventBridge corn schedule and fetch updated contract and grant data. The Lambda function called the API and converted raw JSON response to csv and stored into an S3 bucket, acting as our landing zone for all incoming data.
This gave me a solid foundation: consistent access to fresh data without manual intervention.
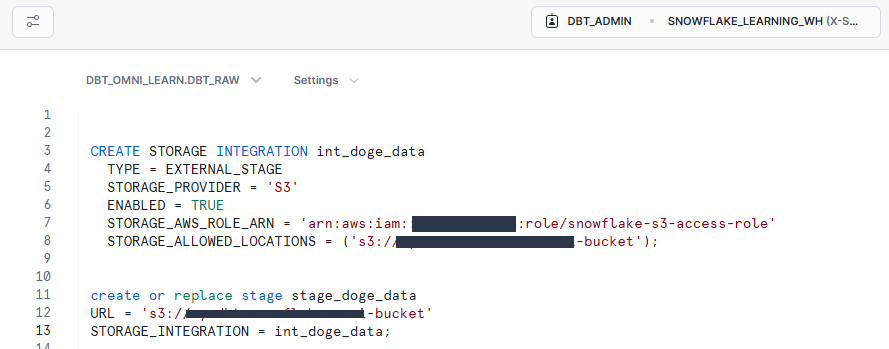
2. Loading into Snowflake: Structured Storage
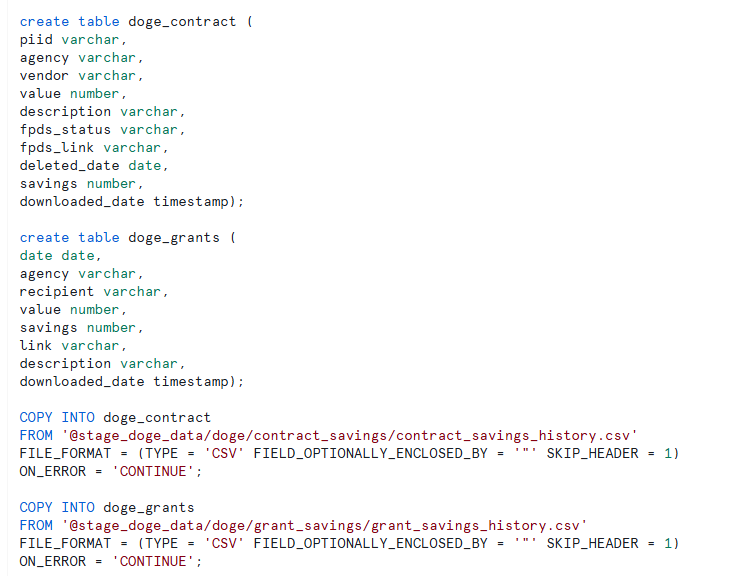
Once the data landed in S3, I set up a S3 storage Integration in snowflake and External Stage, enabling me to pull the raw data into Snowflake using the COPY INTO command. This allowed me to persist the data in raw tables, keeping the original format intact for traceability.
Snowflake became the backbone for everything that followed.
3. Cleaning with DBT: Turning Raw into Refined
With raw tables in place, I turned to DBT (Data Build Tool) for transformation. DBT helped clean the data, normalize schema inconsistencies, and enrich fields (like tagging grant types or mapping agency names). The result was a set of curated Snowflake tables, ready for analysis and consumption.
This was the turning point—the data moved from messy to meaningful.
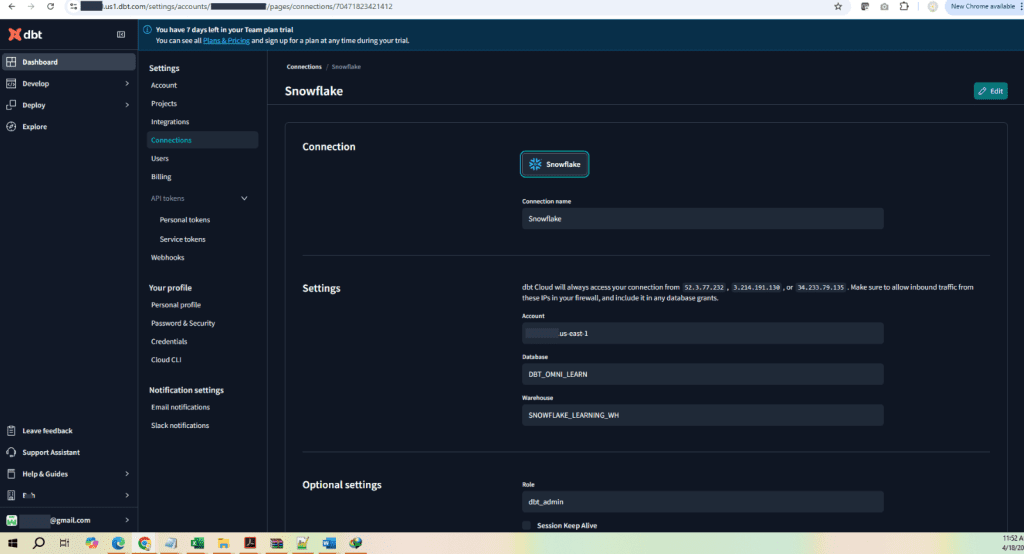
Here is how I have connected snowflake with DBT.
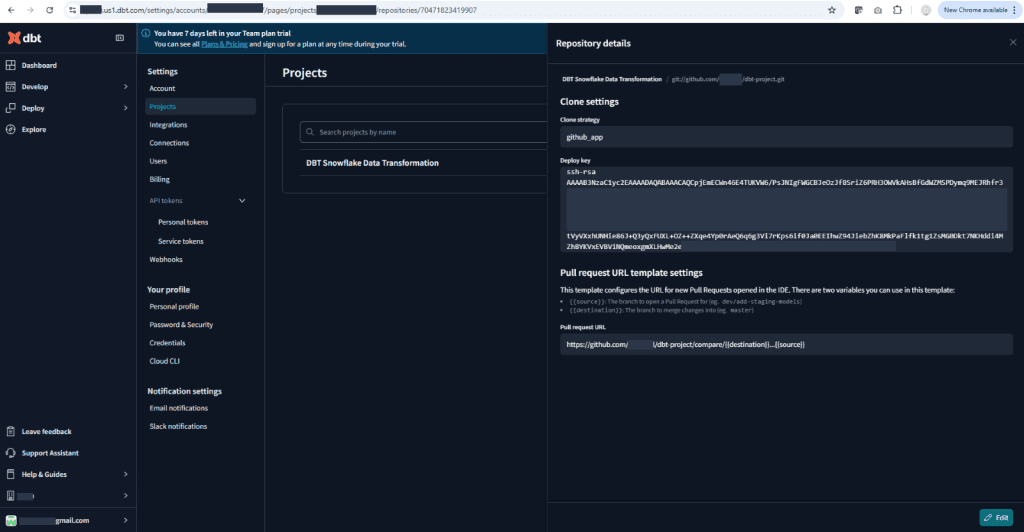
Next connected GitHub into DBT for repository and version control
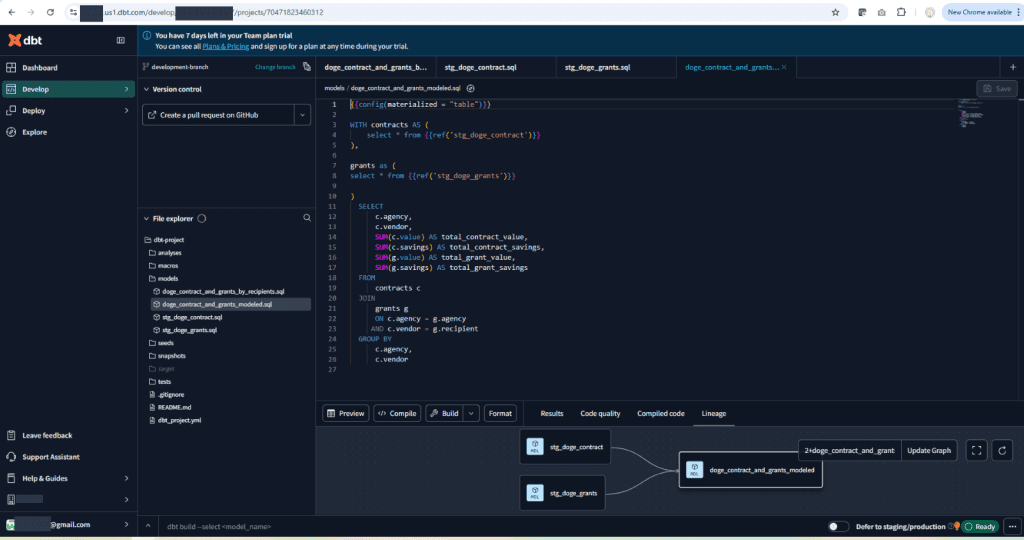
Finally implemented transformation logic in DBT to create tables and materialized views in snowflake.
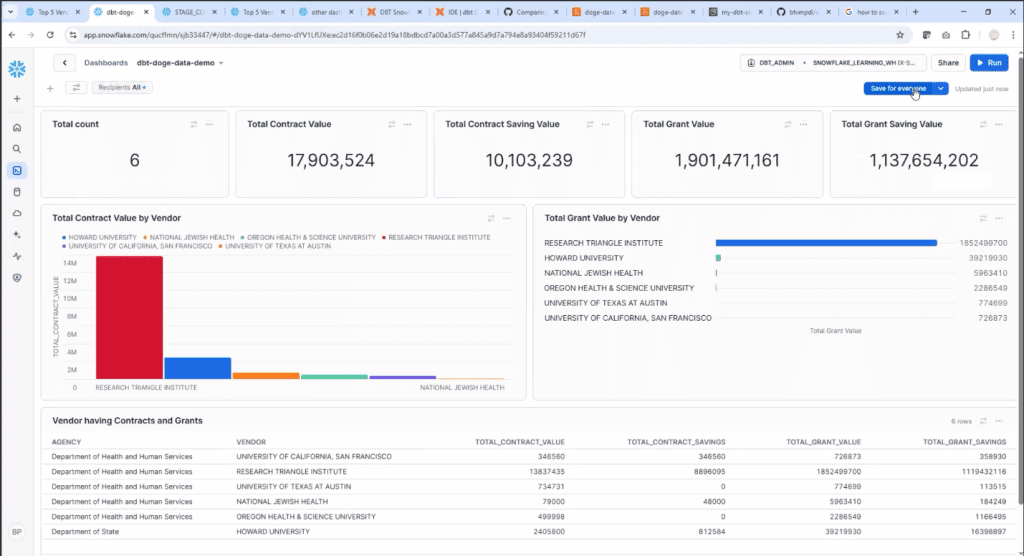
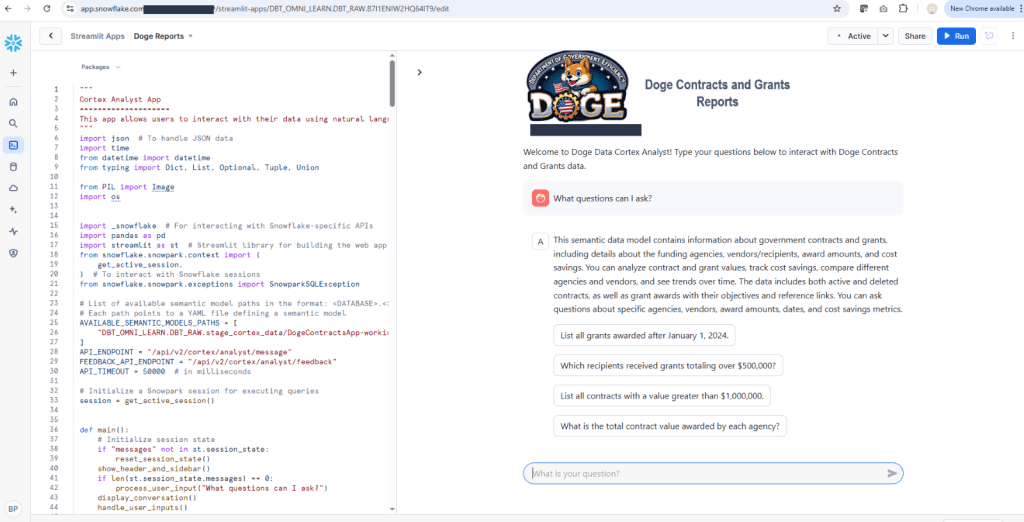
4. Deliverables: Dashboards, Reports, and a Chatbot
From there, the real value started to emerge. I used the curated tables to build:
- A Snowflake dashboard that highlighted trends like top vendors, agency-level spend, and cancellation patterns.
- An automated email service that sends out Excel reports to stakeholders with pre_signed URL link to download the file for non-snowflake user on a schedule—no manual work required.
- And the most interactive piece: a chatbot that translates natural language questions (“Which vendor got the highest grant?”) into dynamic SQL queries, executed on Snowflake and returned with human-readable responses.
Each layer built on the last, making the data more accessible to non-technical users.
5. Lessons from the Build
This pipeline reinforced just how powerful cloud-native tools can be when stitched together right. AWS for ingestion, Snowflake for scale, and DBT for transformation made it possible to go from raw API data to real-time insights—without needing a complex tech stack.
But more than that, it reminded me that the best data systems aren’t just accurate—they’re usable. The ability for someone to ask a chatbot about public Contracts and grants and get a real answer, instantly, is where data becomes truly impactful.