When we first set out to integrate Explainable AI into our MLOps workflow, it wasn’t just about implementing a set of tools. It was about solving a deeper challenge: ensuring that our AI models were not only powerful but also transparent and accountable. The goal was to build trust—trust between the AI systems we build and the people who depend on them. And trust, as I quickly realized, can only be achieved when you can explain how and why a model makes a decision.
Why Explainability is Crucial
As AI continues to drive more business decisions, we face growing demands for transparency. Whether it’s stakeholders seeking insights into AI-driven decisions or regulatory bodies pushing for clear accountability, the ability to explain AI models is no longer optional—it’s essential.
By making our models more interpretable, we could address ethical concerns, prevent biases from creeping in, and stay ahead of compliance regulations. But achieving this didn’t just mean adding a layer of explanation to our models—it meant embedding that capability throughout the entire lifecycle of our AI development.
Dashboard Creation with Grafana and PostgreSQL MLflow Database
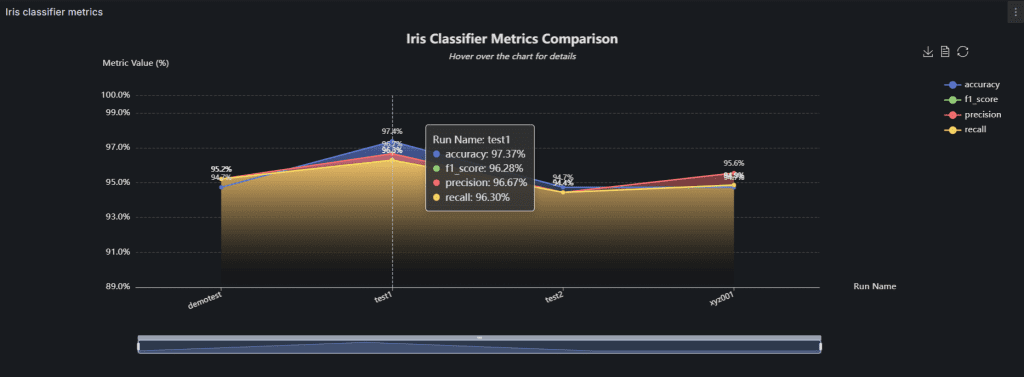
The no-brainer approach is to utilize open-source tools to effectively monitor and visualize machine learning experiments. As a practical example, our team trained and evaluated an Iris Classification Model aimed at predicting iris flower species based on input features. The primary objective was to assess and enhance the model’s classification accuracy and precision.
This workflow involved:
- Experiment Tracking with MLflow: Recording detailed experiment metadata, parameters, metrics, and artifacts. Multiple experimental runs (e.g., demotest, test1, test2, xyz001) were conducted to optimize hyperparameters and monitor performance variations.
- Data Storage in PostgreSQL: Securely storing recorded MLflow experiments, runs, and associated metrics.
- Visualization using Grafana: Establishing intuitive dashboards connected to PostgreSQL to display key metrics, including accuracy, precision, recall, and F1 scores. These visualizations provided rapid evaluation and debugging capabilities across multiple experiments and iterations.
Extending Capabilities with Palantir Foundry
While Grafana and PostgreSQL gave us a solid foundation, I knew there was more we could do. That’s when we started integrating Palantir Foundry into our workflow. The idea was to level up our explainability strategy by making our model tracking and data transformation processes even more robust. Here’s how we took it to the next level:
- Data Source Integration: Connecting the same PostgreSQL MLflow database directly to Palantir Foundry, enabling streamlined and reliable data ingestion.
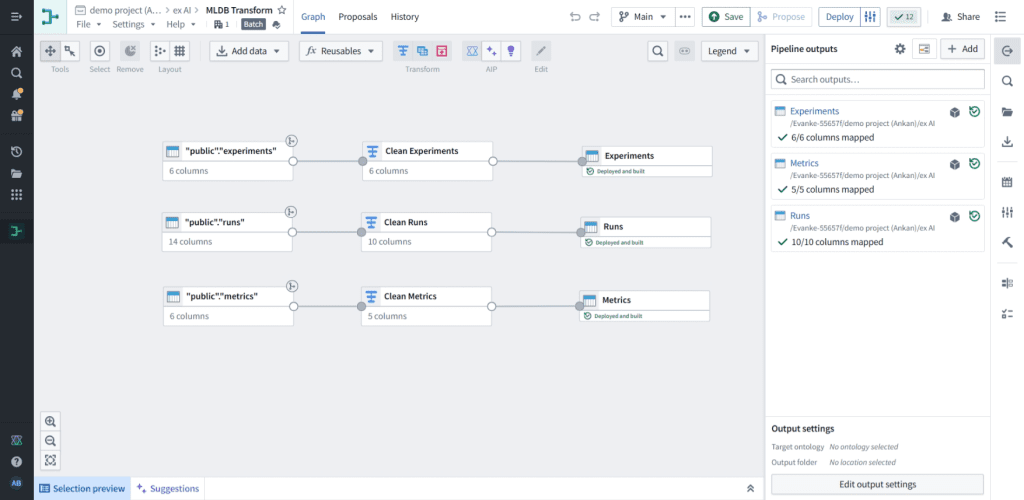
- Table Selection and Preparation: Selecting crucial tables—specifically “experiments,” “runs,” and “metrics”—for deeper analytics within Foundry.
Data Transformation via Palantir’s Pipeline Builder
- Executing comprehensive data cleaning and transformation processes, which included:
- Removing irrelevant columns to streamline datasets.
- Converting timestamps from milliseconds to standardized datetime formats.
- Filtering runs to retain only active and completed experiments.
- Ensuring the presence and integrity of run identifiers.
- Clearly renaming fields and removing entries with invalid numerical values.
Ontology Creation using Palantir Ontology Manager
Using Palantir’s Ontology Manager, we structured our data into clear object sets. This made it easier to manage, retrieve, and explore data in a way that was intuitive and actionable for the entire team.. Three distinct object sets corresponding to the tables were created, along with defined link types to establish clear relationships between these object sets.
Visualization through Palantir Quiver
At last we utilized the structured object sets within Palantir Quiver to develop dynamic, interactive dashboards including:
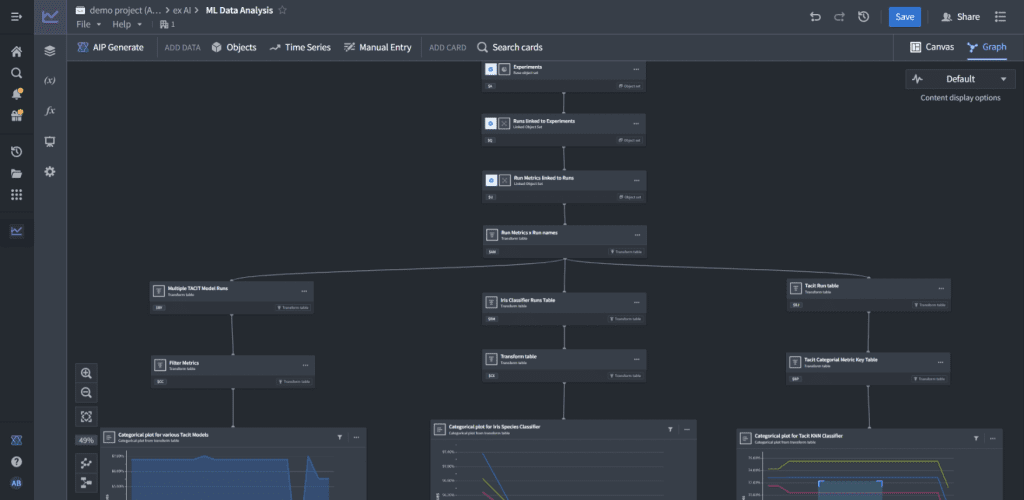
- Importing object sets and linked object sets into Quiver.
- Performing a join between the runs and metrics tables and creating a transformed table with an additional “run_name” column with the linked metrics table.
- Setting up appropriate filters, including filters based on experiment IDs and other relevant fields.
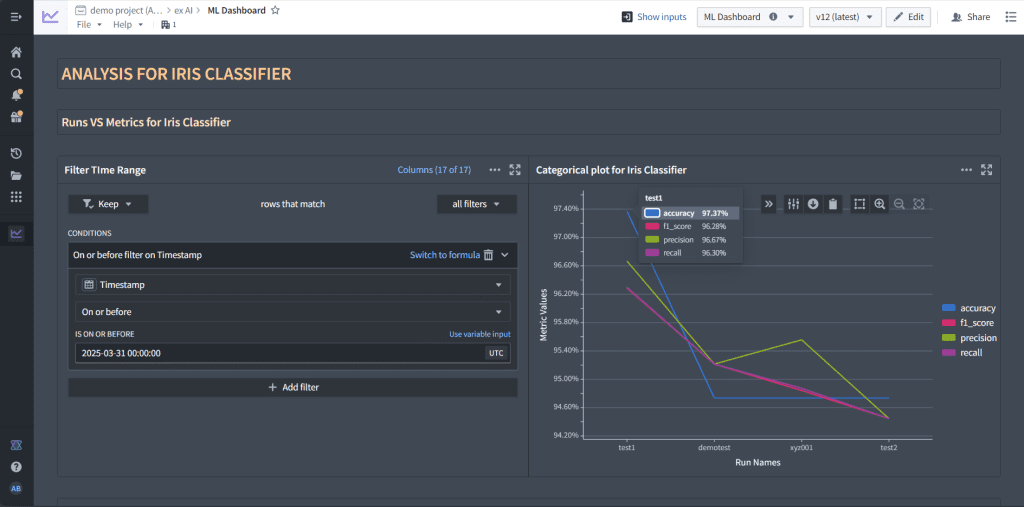
- Developing dynamic, interactive dashboards providing detailed insights into model performance.
These dashboards offer granular insight into model performance across different runs for an experiment or across experiments, significantly enhancing the clarity and interpretability of AI-driven results.
The Outcome: Clearer Insights, Better Decisions
Through these tools, we were able to achieve something bigger than just tracking performance: we made AI more understandable for everyone involved. By integrating explainability directly into our workflows, we could now provide clear, actionable insights at every stage of development. Whether it was for debugging, model optimization, or addressing regulatory concerns, we had the visibility we needed.
Reflecting on the Journey
Looking back, the evolution of our Explainable AI approach wasn’t just about the technical tools we used—it was about the lessons we learned along the way. We saw firsthand how important it is to build AI systems that are not just “smart” but also transparent. While the tools we use are critical, the real value comes from embedding a mindset of explainability into everything we do.
By combining open-source tools with more specialized solutions like Palantir Foundry, we’ve been able to make AI decision-making processes not only more explainable but also more trustworthy. As we continue to evolve, I’m excited to see where we can push the boundaries of AI transparency even further. It’s not just about building better models; it’s about building models that we, and everyone else, can trust.

